 “Making money is art and working is art and good business is the best art.”
When an eclectic artist like Andy Warhol could quip about the art of money, then we can all realize the inescapable role that financial services play in nearly every industry and in the way most Americans conduct their daily lives. The business of managing money is a complex array of interrelated activities such as banking, stock brokerages, insurance, credit cards and investment funds.
The outmoded Standard Industrial System (SIC) previously grouped Finance, Insurance, and Real Estate (FIRE) into a single nomenclature. But with the development of the 1997 NAICS (North American Industrial Classification System), Real Estate was relegated to a separate two-digit code and Finance and Insurance was retained as a single heading (NAICS 52). By 1999, the modern financial services sector was firmly established through Congress’s passage of the Gramm-Leach-Bliley Act which allowed independent companies that provide integrated financial operations to merge, thus repealing these restrictive provisions of the 1933 Glass-Steagall Act.
In 2012, the US Census Bureau’s Economic Census indicated that the nation’s 486,183 Financial Services sector establishments had an average employment of 13 persons and generated $3.64 trillion in annual revenue. Productivity averages for the industry in 2012 equated to $601,900 per employee.
 Defining the Financial Services Industry
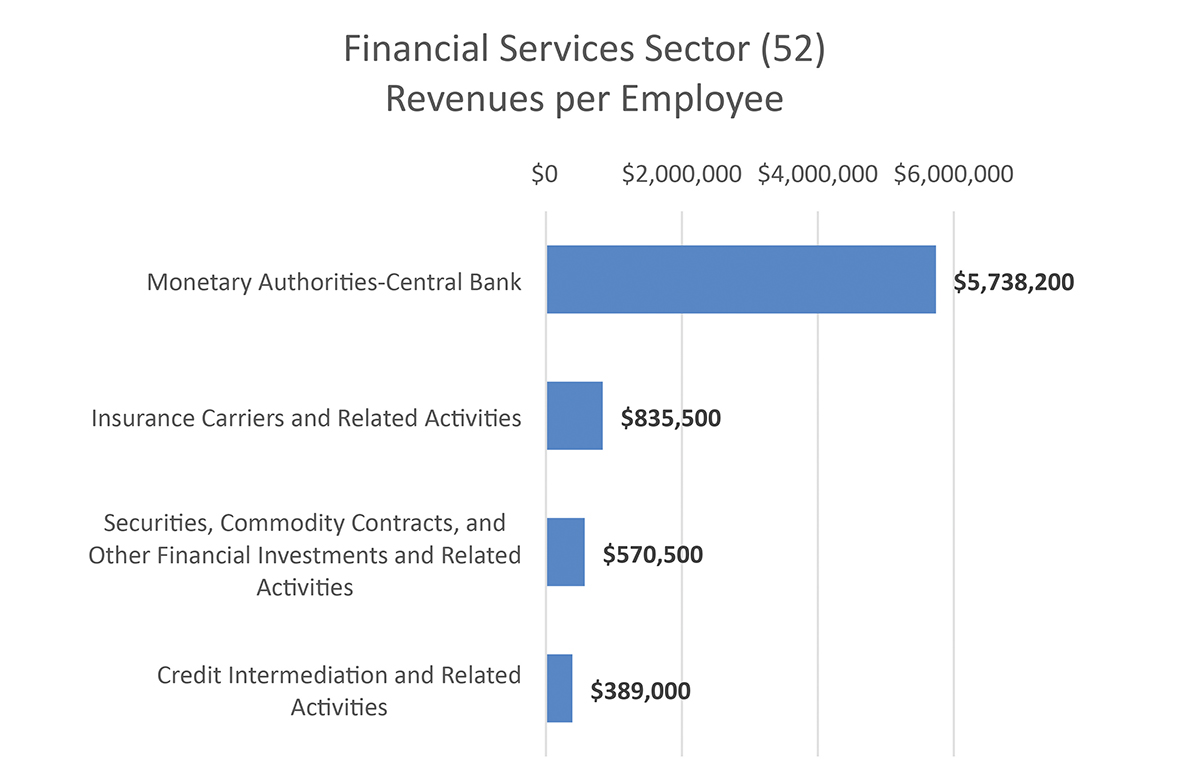
Through the NAICS hierarchy for the Financial Services sector (52), there are five subsectors that comprise the industry:
• Monetary Authorities-Central Bank (521)
• Credit Intermediation and Related Activities (522)
• Securities, Commodity Contracts, and Other Financial Investments and Related Activities (523)
• Insurance Carriers and Related Activities (524)
• Funds, Trusts, and Other Financial Vehicles (525).
Productivity in the financial services subsectors of NAICS 52 ranged from a high of $5,738,200 per employee in the Monetary Authorities-Central Bank (521) to a low of $389,000 in Credit Intermediation and Related Activities (522).
Note: Funds, Trusts, and Other Financial Vehicles (525) are not tracked by the Economic Census.
Employment and Earnings
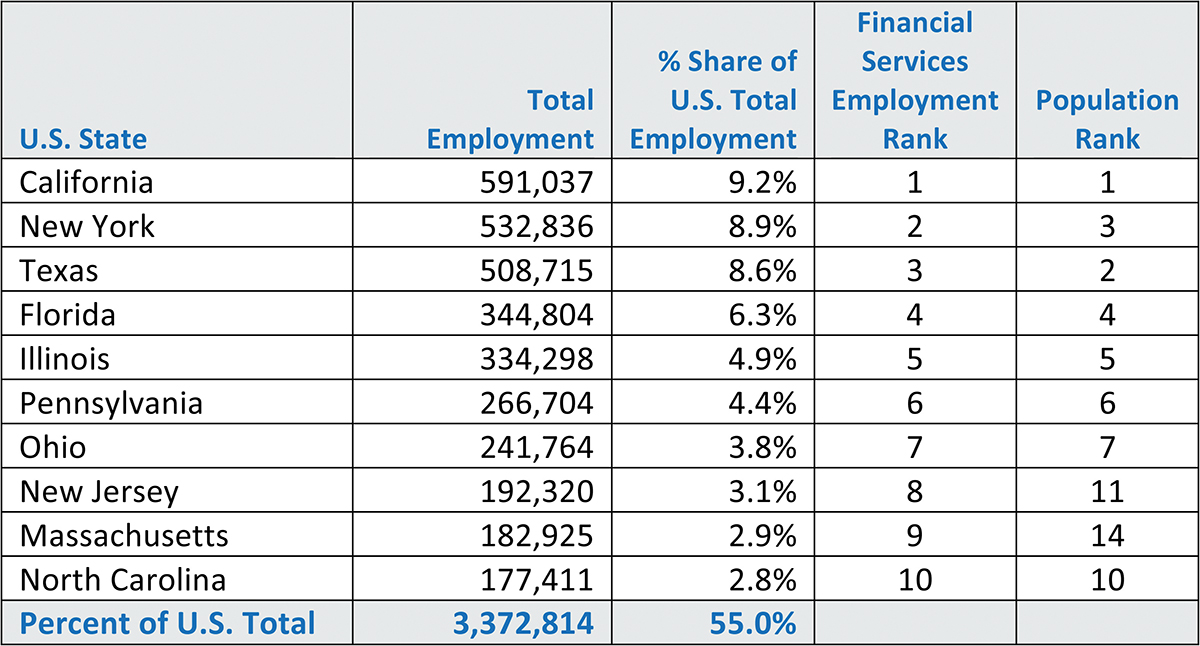
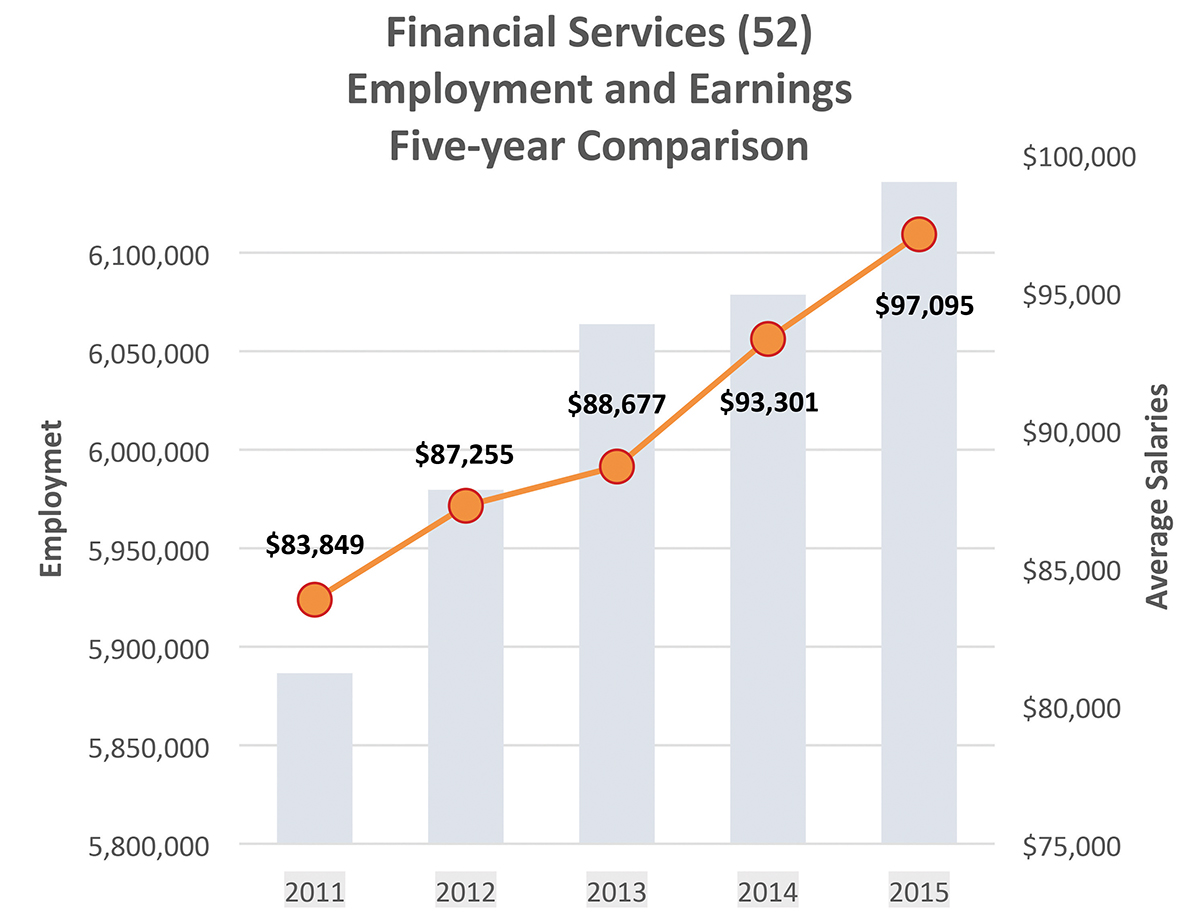
The financial services industry is present in all 50 U.S. states and today there are about 6.1 million persons employed in this industry. The 10 states listed in the table below collectively represent more than half of the nation’s overall sector employment. But as shown in the table, employment ranking in the industry varies slightly from population ranking, indicating that industry employment does not correlate directly with population patterns.
As the economy improves, the search for qualified labor is an ongoing challenge for most industries, and the financial services sector is not immune to this problem. For companies seeking locations for growth or new business development, finding well-trained professionals is essential. And while every site selection investigation is unique, there are examples of commonality, such as identifying leading occupations.
As an illustration, the five most prevalent occupations by employment count in the Monetary Authorities-Central Bank (521) subsector are:
1. Financial Examiners
2. Financial Analysts
3. Management Analysts
4. Security Guards
5. Software Developers, Applications.
1. Tellers
2. Loan Officers
3. Customer Service Representatives
4. Loan Interviewers and Clerks
5. First-Line Supervisors of Office and Administrative Support Workers.
For Securities, Commodity Contracts and Other Financial Investments and Related Activities (523), the five are:
1. Securities, Commodities, and Financial Services Sales Agents
2. Personal Financial Advisors
3. Financial Analysts
4. Brokerage Clerks
5. Office Clerks, General.
 For Insurance Carriers and Related Activities (524):
1. Insurance Sales Agents
2. Customer Service Representatives
3. Insurance Claims and Policy Processing Clerks
4. Claims Adjusters, Examiners, and Investigators
5. Insurance Underwriters.
For Funds, Trusts and Other Financial Vehicles (525):
1. Securities, Commodities, and Financial Services Sales Agents
2. Secretaries and Administrative Assistants, Except Legal, Medical and Executive
3. Personal Financial Advisors
4. Office Clerks, General
5. Accountants and Auditors.
By combining all subsector occupations into the overall Financial Services sector (52), the five most common positions that emerge are financial managers, general and operations managers, customer service representatives, financial analysts and office clerks, general. By evaluating where these jobs are most plentiful by actual employment, not just by those seeking work, gives clue to where competition is focused. For most companies, acknowledging where competitors are located and determining if there is opportunity for additional business development usually outweighs the desire to be the first to capitalize on an unproven labor market.
Financial services companies find potential expansion or relocation markets through detailed and exhaustive analysis, usually performed by a competent site selection consultant. The process can be very complicated, and management’s role is to evaluate the market recommendations arrived at by the consultant through the company’s internal lenses of strategic planning and bottom-line profitability. The consultant is rarely briefed on sensitive company intelligence, but asked to identify candidate sites based on location criteria supplied through interviews with the company.
 A Brief Case Study
Let’s assume that the five positions noted above are important considerations for a client, and finding available labor supply at good rates will help to qualify the site selection decision. From the location criteria interview, the client wishes to choose a market that exhibits exemplary representation in each of the five job descriptions, but with the lowest-possible total salary cost.
Financial Managers — According to the Bureau of Labor Statistics (BLS), the 10 U.S. markets with the greatest number of financial managers by total employment are New York City, Chicago, Boston, Los Angeles, Washington DC, Atlanta, Minneapolis, Houston, Phoenix and Anaheim. The national mean wage for this position is $139,720.
eneral and Operations Managers — The BLS lists the 10 U.S. markets with the greatest number of general and operations managers as New York City, Chicago, Los Angeles, Atlanta, Washington DC, Houston, Boston, Dallas, Phoenix and Minneapolis. The national mean wage for this position is $122,090.
Customer Service Representatives — The 10 leading markets for customer service representatives are New York City, Chicago, Phoenix, Atlanta, Dallas, Los Angeles, Houston, Tampa, Minneapolis and Boston. The national mean wage for this position is $35,170.
Financial Analysts — The 10 leading markets for financial analysts are New York City, Chicago, Boston, Washington DC, Houston, Los Angeles, San Francisco, Dallas, Atlanta and Minneapolis. The national mean wage for this position is $97,640.
Office Clerks, General — The 10 leading markets for office clerks, general are New York City, Los Angeles, Chicago, Houston, Dallas, Washington DC, Atlanta, Phoenix, Minneapolis and Austin. The national mean wage for this position is $33,010.
By comparing the 13 individual markets that are listed throughout the five occupational categories, six cities emerge as always among the top 10:
• Atlanta
• Chicago
• Houston
• Los Angeles
• Minneapolis
• New York City.
As an initial screening, therefore, these six markets are promoted for further evaluation. The next step is to quantify available labor in each of these six markets.
By examining the BLS data, the employment levels for each occupation are estimated for labor supply by computing the U6 unemployment rates in each market against 2016 employment to arrive at a reasonable estimate of available labor supply. The U6 rate is a better measure of unemployment than the widely published U4 unemployment rate as it considers underemployed persons as well. The third quarter 2017 U4 unemployment rate for the United States was 4.8 percent, but the U6 rate of 8.9 percent is more in line with the true economic picture.
Calculation and subsequent ranking of available labor puts New York City in first place, followed by Chicago, Los Angeles, Atlanta, Houston and Minneapolis.
Since wage costs are a consideration, ranking by annual wage results in a different ordering: Atlanta, Minneapolis, Chicago, Los Angeles, Houston and New York City.
To arrive at a short list of three markets, a simple average of final marks would normally be performed. But in this case, the client recognizes that labor costs are even more important than labor supply, so a weighting factor is employed in the final ranking. The concluding short list for this example produces these three final recommendations:
1. Atlanta
2. Chicago
3. Minneapolis.
Location Guidance for Financial Services
The preceding case study only provides a cursory review of the type of in-depth analysis needed to identify a suitable location for a financial services organization. Missing are important human elements such the number of employees, work hours, payroll benefits, exempt vs. non-exempt personnel expected to move or to be locally hired, selectivity ratio, turnover, training requirements and quality of life amenities. Operational components still to be addressed include office rental or purchase costs, CBD vs. suburban locations, electric utilities, telecommunications, transportation and incentives. Organizational elements include state tax exposures, regulatory requirements, time zones and impacts of competition.
Attempting to establish a set of universal location guidelines for the financial services industry is impossible — it’s just too wide a net with too many variables to be considered. However, some essentials are necessary for any company in the financial services arena and therefore their location consultants to consider when contemplating expansion or relocation strategies.
• Benchmarking – evaluate administrative processes, IT operation, sales, customer support, HR, accounting and other business activities. Determine inefficiencies that exist within the organization and isolate those that may be sensitive to economic geography. A call center unit within a headquarters may be more efficiently operated from a remote location with lower operating costs.
• Millennial labor supply – young professionals are increasingly becoming attracted to urban centers as opposed to a suburban lifestyle, so awareness of demographic shifts is imperative. Examine markets that have competent labor supply but be prepared for new learning, knowledge management and other challenges especially for newer generation workers with different attitudes toward performance, compensation, technology, etc.
• Capital centers – the financial services sector ultimately revolves around the flow of capital, and the monetary authorities — central banks, more commonly known as the Federal Reserve Bank branches — are in the following cities: Atlanta, Boston, Chicago, Cleveland, Dallas, Kansas City, Minneapolis, New York, Philadelphia, Richmond, San Francisco and St. Louis. Locating in reasonable proximity to these money centers may prove a wise investment for certain industries.
• Business analytics – combine business performance analytics with external market data to determine growth or diminishment within the customer’s industry and predicts future cost savings and opportunities for service improvements.
Looking Ahead
The dynamic rise in stock market value has already positively impacted the financial services industry, and the new tax plan should provide even more impetuous for business development. With the initiation of the groundbreaking 2017 Tax Cut and Jobs Act, companies with offshore financial assets will be able to repatriate these funds under a much more favorable tax exposure. This alone could promote new job creation for tens of thousands of business professionals in finance industries.
Although the jury is out on the ultimate performance of the new tax bill, the reduction of corporate income tax rate to 21 percent must be viewed as a potential touchstone for economic growth. Financial services companies will likely continue to expand where they can best serve their client base, namely the major market cities of the U.S. Young professionals already drawn to the urban lifestyle should expect a continuing call for finance skills needed to meet the growing national and global demand. T&ID
Related Agencies
About the Author