Companies have long assessed business metrics such as cash flow, assets and return on investment (ROI) when making decisions regarding the location of offices and facilities or the opening of distribution centers. There is now a new metric to add to the equations – the environment. Green metrics are becoming an important element of business decisions that must be considered at all levels. Interestingly enough, taking steps to improve your environmental footprint can have significant benefits to your organization’s bottom line. The green movement is all about optimization, and optimization leads to cost-effectiveness.
 It is not a foreign concept that if an activity reduces carbon, it probably reduces cost. Simple things like recycling, changing out light bulbs, sealing doors and insulating roofs all have the potential to significantly reduce your energy bill and therefore your carbon footprint. Other steps like implementing light monitoring systems provide day-lighting in warehouses and exposure to constant daylight will reduce electricity costs – again leading to a lower carbon footprint.
Surveys show that consumers, shareholders, and stakeholders favor “green” companies. A study conducted by Green Seal found that despite the poor economy, four out of five consumers stated that they were buying some level of green products and services. Sustainability rankings, like the Dow Jones Sustainability Indexes, are becoming increasingly part of the decision making process; investors are beginning to demand company disclosure and accountability. Ceres, a national network of investors, environmental organizations, and public interest groups, announced in March that shareholders filed a record 95 climate change-related resolutions with 82 U.S. and Canadian companies, a 40 percent increase in resolutions filed over the last year.
As a result, when organizations assess where to build (offices, headquarters, distribution centers), they must consider a variety of factors that will affect their carbon footprint from their supply chain, including logistics, to their power usage and regional resources. All of these metrics need to be built into the site selection process in order to determine the best location from an environmental and business standpoint. The simple fact of where a facility or office building is located can have a significant impact on its carbon footprint given the variability in CO2 emissions from regional electricity production.
So, before you start site selection analyses, you should understand the characteristics and expended energy both locally and across your supply chain. This extends from the goods being manufactured to the energy used to get them where they need to go. The key to developing an accounting system across the supply chain lies in understanding what data you are looking for.
Supply Chain Inputs and Outputs
No matter the size of the organization or the end goals that defining a carbon footprint will serve – all begin with the same central principle: you can’t manage what you can’t measure. And measuring is simply an exercise in data management. Data defines what the scope of the footprint is, and data will define how it can be reduced in the future.
 Site managers should be thinking about requirements in the Carbon Disclosure Project and other organizations such as Walmart, U.S. EPA, Dow Jones, and state purchasing departments. Where companies get their electricity and fuel will play an increasingly important role in optional and required reporting. The Carbon Disclosure Project asks for a Greenhouse Gas (GHG) inventory, whereas government purchasing agencies require specific material or energy reductions. Answering these questions can be demanding, and this exercise often sparks internal struggles. “Future-proofing” your supply chain to identify what emissions need to be reported—whether to an outside organization, governmental body or shareholders—is the most critical step in developing an accounting system that can scale and evolve as business needs change.
The first step to identify the energy output for manufactured goods is to find the inputs. These are the energy sources and raw materials that go into producing a specific good. The core parts of the output are the energy expended by facilities. This analysis can be easily controlled for your own facilities and will help define the key benchmarks of your energy output. It should also include water inputs, in addition to energy inputs, to ensure a complete assessment. Unlike analyzing your own facilities, it can often take a while to gather this information from external suppliers and provide guidance on what’s needed. State government agencies have been working to account for the energy and carbon associated with state government purchases. The difficulty has been in getting suppliers to readily provide information about the energy and carbon associated with the products they offer to procurement officers.
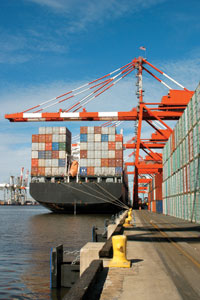
The next step is to understand the logistics of shipping – what you’re shipping, where you’re shipping it from and where it’s travelling before arriving at its final destination. Energy is expended in goods from suppliers and from commodities. Where it originates can often be difficult to determine depending on regional regulatory requirements. For example, facilities in China and India often aren’t required to report emissions. When developing a strategic plan about the emission sources you need to collect, it must include the places you receive supplies from.
One example is the potential for ozone depleting chemicals (ODCs) being included in the manufacture of products or components imported from facilities overseas. This requires assessing the inclusion or use of ODCs throughout a supply chain. Not knowing whether ODCs are in the product or used in the manufacture of the product, can result in significant taxes owed to the Internal Revenue Service (Sections 4681 and 4682 of the Internal Revenue Code).
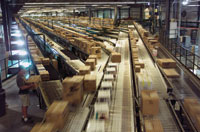
Distribution Logistics
Once you understand your supply chain inputs and your requirements, you can begin to assess your business logistics and the shipment of goods to and from your distribution centers. Factors such as the type of transportation used and how close you are to these resources all play a role. For example, if your supplies are coming in from overseas, it is ideal to be located closer to a port so they don’t need to be trucked a great distance. This will significantly reduce fuel costs (with its volatile and rising prices), saving business dollars and lowering carbon emissions.
 When it comes to fuel, I often advise clients to think: if it is good for the environment, it is good for your bottom line. For example, UPS reduced left-hand turns in order to minimize engine idling, fuel consumption and traffic delays. Since introducing its Package Flow Technology program in 2003, UPS has shaved 100 million miles from its delivery routes, reduced fuel use by ten million gallons and carbon emissions by more than 100,000 metric tons.
Another way to approach logistics optimization is to make sure the truck is the fully-packed. SC Johnson saved 1,800 tons of GHG emissions and $1.6 million in 2007 by packing more product into each truck shipment. Some companies with large fleets such as FedEx and Coke have been testing hybrid vehicles. Whatever approach you take, you need to be sure that a logistics initiative (including site selection) plays a large part into your overall GHG reduction strategy.
Many companies have reconfigured their entire sourcing strategy in order to lower fuel costs. For example, warehouses are often found right next to shipping ports or rail lines and distribution centers in areas with easy access to immediate transportation needs. However, you also need to consider what products you are shipping and where your target customers are located. For example, the amount of energy expended to ship recycled products a far distance may surpass the environmental savings gained from using recycled materials. Understanding the trade-offs between the carbon reduced from one factor and the carbon increased from another factor is becoming significant in terms of meeting carbon reduction goals.
Required energy sources also affect your carbon footprint and have the potential to lead to tax break incentives. It is important to understand how the natural resources of regions will affect your carbon footprint. Ideally, it should map to the energy sources that your manufacturing system requires. One way to think of it is that you are better off purchasing energy where energy is being generated. For example, areas that receive a lot of sunshine, such as the Southwest, offer opportunities to build photovoltaic (PV) arrays to power facilities. Areas like the Northeast, where wind power has the potential to play a large role, may create a different set of available resources through offshore wind generation.
Looking to the Future
Outside of energy and carbon, water is another green metric to be considered in site selection. Although GHG has been leading climate change discussions, water is next on the global agenda. Last November, the Carbon Disclosure Project (CDP) launched CDP Water Disclosure, a project to help businesses and institutional investors understand the risks and opportunities associated with water scarcity and other water-related issues. According to Climate Action, 302 companies—including Molson Coors, Ford, Pepsi Co, Coca-Cola and HSBC—have committed to submit information to the CDP Water Disclosure as of last April.
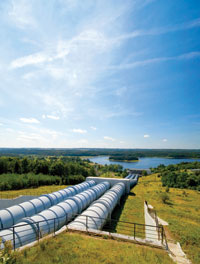 Water availability is very important in site selection. Regional considerations, such as the need for clean water, sufficient water supply and the long-term availability of water are topics of great concern for many organizations. Companies must ask themselves, are there available water supplies in this region or will we be depleting a local aquifer; are there going to be increased factors for drought. The water source is also important because the further away, the more energy is expended to pump the water – leading to a greater carbon footprint.
State energy grids are great resources to determine how to optimize energy and environmental considerations. There are also government and industry sites that break down water, rainfall and drought. The Emissions & Generation Resource Integrated Database (eGRID) is a good resource for data on the environmental characteristics, including carbon emissions, of electric power generated in the U.S. The eGRID website is a user-friendly application that allows the user to select, view and export data.
Data management systems allow organizations to more easily input and manage GHG emissions and other sustainability data. Whatever data system you select or already have in place should capture data concurrently at the company, facility and product level. This has proven to be more efficient than capturing data in silos.
In order to future-proof your business and supply chain and build a credible and long-standing environmental footprint, it takes a balance between business metrics and environmental metrics. Understanding your inputs and outputs and making environmental decisions that map to your organization and supply chain will be beneficial when determining the best sites for offices, manufacturing facilities and distribution centers for your business.
About the Author