The U.S. wind energy industry achieved its best year ever in 2012, shattering numerous records. It installed 13,131 megawatts (MW) of capacity and surged past the 60-gigawatt (GW) milestone for total installed wind power capacity. Last year the industry invested over $25 billion in private capital to build new wind projects in the U.S., pushing the five-year average annual investment level to $18 billion between 2008 and 2012.
The result: for the first year ever, wind energy was the No.1 source of new electricity generating capacity, contributing 42 percent of all the megawatts the power sector installed. More than 180 wind projects were built.
It was also in 2012 that the U.S. wind energy industry surpassed the 50-GW benchmark — and it happened just five months earlier. What does 10 GW in just a few months mean? To put it in perspective, it took the industry 25 years to reach 10 GW of total installed capacity; that came in 2006, when industry performance really took off. Just two years later in 2008, U.S. wind power doubled in capacity, hitting 20 GW, and then it took only one year apiece to reach the 30 GW and 40 GW milestones in 2009 and 2010, respectively.
The 60 GW installed today represents enough electricity to power the equivalent of 15.2 million American homes. That’s equal to all the households in Colorado, Iowa, Maryland, Michigan, Nevada and Ohio combined. The 60 GW of wind power now deployed can avoid nearly 100 million metric tons of carbon dioxide (CO2)—equivalent to more than four percent of all power-sector CO2 emissions.
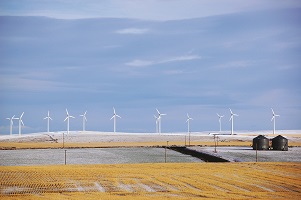
Iowa and South Dakota now produce more than 20 percent of their electricity from wind energy. Meanwhile, even some of the nation’s largest state economies have significant wind power penetrations. The operating system in Texas, ERCOT, reached 10 percent wind energy on its system. Nine states now receive more than 10 percent of their electricity generation from wind energy.
Manufacturing: Supply-Chain Trends
The late-year surge was in part driven by the then-pending expiration of the federal Production Tax Credit (PTC) for wind energy, the industry’s primary policy driver in the U.S., which was set to expire at the end of the year. The PTC has always been extended in short-term increments (usually just for one or two years). While wind turbine component orders within the industry supply chain began to slow down in the second half of the year in anticipation of a possible expiration (even as developers completed projects at a record pace with completed turbines), Congress’s extension on Jan. 1, 2013, for projects that start this year has sent the industry back to work.
In addition to the industry's record growth last year, a growing trend augured well for its future: new purchases of wind power were made by 74 electric utilities, along with at least 18 major industrial consumers and 11 school and universities — all taking advantage of the chance to diversify their energy portfolio and stabilize and lower energy costs, typically via long-term, fixed-rate contracts. Rising utility interest has been seen again this year since the PTC extension, with at least seven utilities issuing new requests for proposals to purchase over 1,000 MW of wind power. RFPs continue to be issued.
The bottom line is that wind energy is becoming ever more attractive, and utilities, showing an understanding of the renewable resource, are eager to tap its benefits, starting with affordability and price stability. Following are just a couple of examples.
In Michigan, renewable energy contracts submitted to the state Public Service Commission show a downward trend. “Almost all actual renewable energy contract prices are lower than the coal guidepost rate…,” the Michigan Public Service Commission noted in a February 2012 report. Meanwhile, at the opposite end of the country — in the South, where electric rates are generally known to be low — American Electric Power subsidiary Southwestern Electric Power Co. signed power purchase agreements totaling 358.65 MW of wind power from projects in Texas, Oklahoma and Kansas. The result: an average decrease in cost to the utility’s customers of 0.1 cents per kilowatt-hour over a 10-year period starting in 2013.
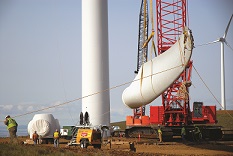
Thanks to continued technology improvement, the cost of wind keeps going down. Taller towers that reach stronger wind resources, along with longer blades that capture more energy, translate into lower overall cost of wind-generated electricity. Hub heights now average over 80 meters, with 1,071 turbines installed during 2012 on towers of 100 meters. Moreover, with wind power, utilities can lock in the price they pay for electricity, protecting themselves against volatile fossil-fuel prices.
Meanwhile, transmission, a much-needed wind-energy enabler, is being built at a robust pace. The three new transmission lines completed in 2012 allow for 1,000 more megawatts of wind to be brought onto the system.
This year and next, the PTC should help create opportunity for wind power growth in almost every region of the country, while various regions will get additional boosts from such market drivers as renewable portfolio standards (New England, the Mid-Atlantic, California and the Pacific Northwest) and the build-out of new transmission (the Upper Midwest and Texas). Driving project development activity in such regions as the territory of the Southwest Power Pool and the Southeast, meanwhile, will be the overall level of load growth and increasingly competitive wind energy costs. All such dynamics will lead to an active industry manufacturing supply chain this year and next.
It should be noted that those drivers are expected to be tempered by such factors as limitations within the broader power market. Market dynamics for wind energy start with the overall power sector, where market size will be dictated (and limited) by power prices and energy demand. Playing important roles in the level of continued wind power capacity build-out will be the nation’s rate of progress on the economic recovery, the resulting load growth and the price of natural gas.

Nevertheless, just one fundamental that works in the industry’s favor is that the cost of producing wind energy is continuing on its downward trajectory, driven by the kind of technology innovation for which the industry has come to be known. Wind energy is delivering affordable electricity, protecting consumers from price uncertainty and fuel price volatility.
In addition, water consumption by other forms of electricity generation cannot be ignored when assessing the market landscape. Wind energy uses virtually no water during generation — an extremely valuable attribute in these times of water shortages in the U.S. Better still, regions of the country with the best wind resources overlap to a great extent with areas most susceptible to drought.
Thanks to innovation and hard work, the industry is ahead of schedule for achieving the milestone of producing 20 percent of America’s electricity by 2030 as outlined in the U.S. Department of Energy's landmark 2008 report showing the feasibility of reaching that benchmark. In light of the market dynamics such as improved technology and the industry's impressive performance that have emerged since the publication of the report, it was just announced at the American Wind Energy Association's (AWEA’s) WINDPOWER 2013 Conference & Exhibition in May that an initiative is now underway to update the report.
Of course, given the industry’s history of surpassing all expectations, no doubt it will be difficult to envision what the industry can do going forward.
Related Agencies
- Ohio Development Services Agency
- Michigan Economic Development Corporation
- The Alliance (California)
- Upstate California Economic Development Council
- Northern Nevada Development Authority
- Nevada County Economic Resource Council
- Texas Economic Development Corporation
- Iowa Falls Area Development Corporation
- Iowa Lakes Corridor Development Corporation
- Kansas Department of Commerce
About the Author