 Site selectors look at a number of factors when analyzing and evaluating potential locations for clients and this includes clients in the food processing and manufacturing industry.One of those areas examined includes The Tax Foundation State Tax Climate Index.
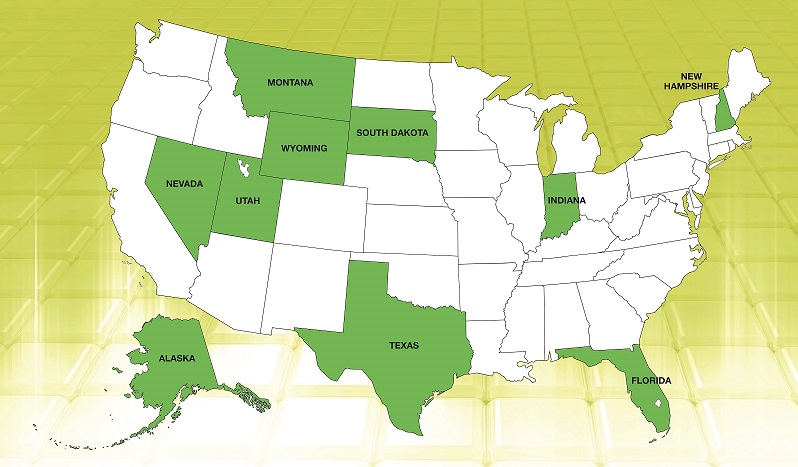
The Tax Foundation State Tax Climate Index allows business leaders, government policymakers and taxpayers to gauge how their states’ tax systems compare nationally. The index is designed to show how well states structure their tax systems and provides a road map to improving tax structures. This resource is often a go-to indicator for site selectors when analyzing site location opportunities. According to the 2015 Business Tax Climate Index, the Top 10 best states this year are:
1. Wyoming
2. South Dakota
3. Nevada
4. Alaska
5. Florida
6. Montana
7. New Hampshire
8. Indiana
9. Utah
10. Texas
 Interestingly, only one state, Texas, appears on multiple Top 10 lists as a top state for the number of food manufacturing facilities. However, because other states are ranked above Texas on different lists, it indicates there may be other, more prevailing and compelling selection criteria that drive the site location decisions of food manufacturing companies. A brief look at California reveals it not only is the most populated state; it is one of the country’s top agricultural-producing states, according to the United States Department of Agriculture (USDA). New York reveals a robust agribusiness component and represents strong agglomeration in which industry tends to locate near its raw material base and/or market and customer base. New York, in terms of its manufacturing jobs, ranks food manufacturing positions at fourth-highest in the number of positions held.
While all site selection teams begin with a standard set of evaluation criteria, each project has its own nuances and unique set of business drivers and food manufacturing sites are no different. Standard quantitative location inputs used in the evaluation of manufacturing sites may include:
Availability of real estate
Geographic clustering
Business/tax environment
Utility availability and cost
Labor skills, cost and availability
Transportation infrastructure
Administrative approval processes
Regulations
Economic development incentives
Educational assets
 These quantitative data points are well supplemented with other data components such as current trending within the industry and forecasting of industry predictors. Over the past decade there have been some significant issues impacting the food manufacturing industry, including more recent trends such as GMO legislation. By example, in 2012, California food manufacturers were challenged by Proposition 37 which, if passed, would have required labeling of genetically modified organisms (GMOs) in food. At the time, other states tried to pass such legislation and failed. The difference was that California took the issue directly to the voters, who had largely been in favor of the labeling. Just a month before the vote, the YES on Prop 37 constituents were polling ahead of the opposition by as much as 65 percent according to polls conducted by Pepperdine University. However, that didn’t mean the favorable vote was a guarantee. A group of NO on 37 – The Coalition Against the Deceptive Food Labeling Scheme, launched an intensive campaign against the measure. The group’s major donors included Monsanto, DuPont and the Grocery Manufacturers Association (a trade group that represents the interest of companies such as PepsiCo, General Mills, Kellogg and others). In fact, most of the large U.S. chemical and food manufacturers contributed financially to defeat GMO labeling. According to the California Secretary of State website, the list of contributors was extensive and included well-known manufacturers such as Nestle, Post, Campbell, Hershey, The J.M. Smucker Company, Kraft, Cargill, ConAgra, Coca-Cola and many others.
In November of 2012, the Coalition Against the Deceptive Food Labeling Scheme prevailed as California voters rejected the proposition by a narrow majority, 51.4 percent. Fast-forward to June of 2013 when Connecticut and Maine became the first states to pass bills requiring labels on all foods made from GMOs.
 There is great debate nationally regarding GMO labeling, which has a direct impact on food manufacturers, their existing real estate and future location decisions. Many say the real costs associated with GMO labeling will fall upon food manufacturers, which may have to remake their products.
For the past 20 years, Americans have been eating plants in which scientists have used modern tools to insert a gene here or tweak a gene there helping crops tolerate drought and resist herbicides. It is thought that around 70 percent of processed foods in the U.S. contain genetically modified ingredients. Many of those against GMO labeling believe that instead of the labeling providing useful information, the mandatory labeling may intensify people’s misconception that GMOs endanger people’s health. The American Association for the Advancement of Science, the World Health Organization and the European Union all agree that GMOs are as safe as any other food.
The U.S. Food and Drug Administration tests all GMOs on the market to determine whether they are toxic or allergenic and they have concluded they are not. However, people having concerns with consumption of GMOs can seek out other options, one of which may be 100 percent organic, another trend impacting the food manufacturing industry.
Organic food sales in 2013 were $32.3 billion per the Institute of Food Technologists, which indicates remarkable stability over the last decade. Produce and dairy are the top-two organic food categories. The meat, fish and poultry category, which is dominated by poultry sales, gained the most momentum over the past 10 years. Packaged foods, beverages, including soymilk and breads and grains are down slightly from a decade ago but are still very healthy (pun intended).
 Growth in organic agricultural product is taking place in both developed and developing countries worldwide and the competition for major consumer markets in developed countries is increasing. U.S. producers have been struggling to keep pace with growing consumer demand for organic products for over a decade which is further supported by the USDA, which provides accreditation to over 50 organic certifiers in the U.S. According to the USDA’s Economic Research Service, the United States had 3.1 million acres of certified organic cropland in 2011 and 2.3 million acres of certified organic pasture and rangeland. This trend in certified agriculture shows continuing growth.
As a result of what seems to be insatiable consumer demand for organic products, some of the largest North American food and beverage companies have been actively acquiring organic product lines over the past decade to remain competitive and keep pace with the growing market. Since 1995, the number of independent organic food processing companies in the U.S. has reduced significantly. Today, almost all of the organic food on grocery store shelves is produced by a handful of multinational corporations. Some examples include:
Pepsi acquired Naked Juice
Coca-Cola purchased Honest Tea and Green Mountain Coffee
Kellogg purchased Kashi, Morningstar Farms and Bear Naked
General Mills purchased LaraBar
Nestle acquired Tribe Mediterranean Foods
The 2014 Top 100 Food and Beverage Companies have been altered mostly by domestic buying which is in contrast to prior years in which acquisitions were highly focused internationally. The 2014 acquisition trend is toward buying American and growing horizontally, broadening the portfolio and even transforming the company rather than establishing operations overseas.
 With each organic acquisition there are impacts to the traditional food manufacturer because production of “organics” comes with strict federal regulations. After all, organic is a guarantee about how an agricultural product was grown and handled before it reaches the consumer. The USDA’s National Organic Program (NOP) oversees the national organic rule (7 CFR Part 205) that went into effect in 2002. The NOP establishes consistent national standards for organic production, facilitates interstate and international commerce, and assures that organic food meets a consistent standard and protects consumers from fraudulent organic claims.
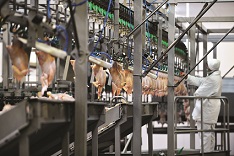
In addition to consolidation within the industry and a continued surge in organics, there are other industry dynamics at play. For instance, the market for meat processing equipment is growing, driven by rising demand for processed foods as a result of the increasing global population and consumer preference for protein-rich processed food products.
According to a report from Research and Markets, the global market for meat processing equipment will expand at a compound annual growth rate of 7.23 percent between 2013 and 2018. This market includes the supply of cutters, blenders, massagers, tenderizing and grinding equipment and machines for dicing, filling and smoking.
 Over the next few years, the research firm expects many vendors to acquire smaller suppliers to enhance their distribution channels and improve their market reach. In turn, this trend is expected to lead more meat manufacturers to automate their meat processing plants with high-end processing equipment, supporting the growth of the global meat processing equipment market during the forecast period.
Private label products, the popularity of which heightened during the economic downturn, have continued to grow in market share even as the economy recovers. With store-brand packaged goods doing $108 billion each year in the U.S., this figure shows that consumer preference for private label and less expensive products is a trend that is continuing and may be here to stay.
Ethnic food processing has been strong for years, and according to Mintel, young Americans and those with children like to spice things up in the kitchen. Per their research, nine in 10 adults aged 25 to 34 years say they have prepared ethic food at home in the past month. In addition, 91 percent of Americans with children under the age of 18 cooked ethnic food in the same period. The ethnic food market is forecasted to grow by 20.3 percent from 2012 to 2017.
Food manufacturers have always been and will continue to be impacted by consumer trends in the industry and Innova Market Insights has identified trends likely to impact the industry in 2015 and beyond:
Clean Labeling – clean label claims are on nearly a quarter of all food and beverage launches with manufacturers increasingly highlighting the naturalness and origin of their products.
Convenience – continued interest in home cooking has been driven by cooking shows on TV and by blogging foodies. This interest has driven demand for great choice of fresh foods, ingredients for cooking from scratch and a wider use of recipe suggestions by manufacturers and retailers.
Marketing to Millennials – the 15 to 35 age group now accounts for about one-third of the global population and they are tech-savvy and socially engaged. They are interested in trying new things and are generally less brand loyal than older consumers.
Snacks Foods – Formal mealtimes are continuing to decline in popularity and a growing number of foods and drinks are now considered to be snacks. Quick, healthy foods are tending to replace traditional meal occasions.
Good Fats, Good Carbs – with concerns over obesity, there is a growing emphasis on unsaturated and natural fats and oils that has seen rising interest in omega 3 fatty acid content as well as the return of butter to favor as a natural, tasty alternative to artificial margarines that may be high in trans-fats.
 With these trends at the forefront, per the 2014 Manufacturing Trends survey, these are the top priorities for food manufacturers.
Food safety
Cost control
Food Safety Modernization Act
Inspection/certifications
Sourcing and materials
Automation
Labor
Energy cost and availability
Environmental/sustainability
Solid waste management
Wastewater management
Sources:
www.foodprocesing.com/top100/top-100-2014
Minnestoa Department of Agriculture – Organic Food Processing Basics
Organic Industry Structure: Acquisitions & Alliances, Top 100 Food Processors in North America, Phil Howard, Associate Professor, Michigan State University
www.ext.colostate.edu/publs/foodnut/09371.html
http://taxfoundation.org/article/2015-state-business-tax-climate-index
www.foodprocessing.com/articles/2014/manufacturing-trends/
Innova Market Insights, Top food and beverage trends for 2015
About the Author