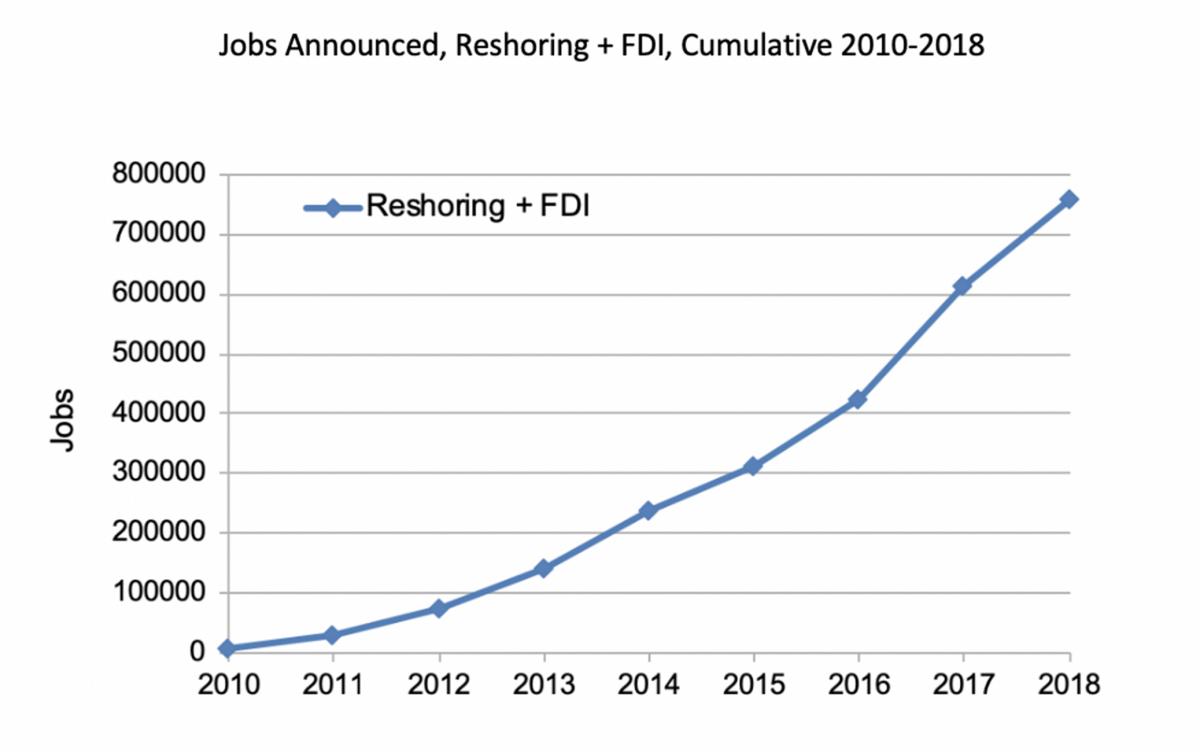
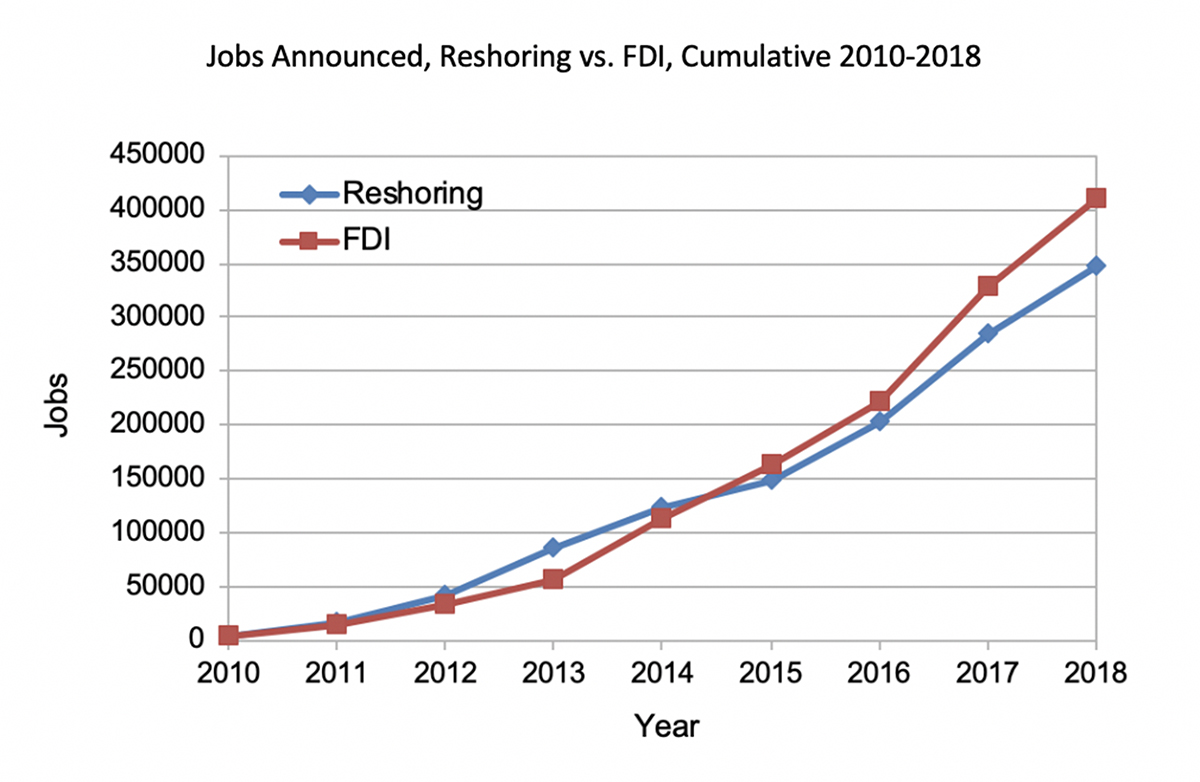
Reshoring and FDI job announcements in 2018 reached the second highest annual rate in history, bringing the total number of jobs brought to the U.S. from offshore to over 757,000 since the manufacturing employment low of 2010. (See Charts 1 and 2 on Reshoring and FDI.). This flow of jobs has driven 31 percent of the total increase in U.S. manufacturing jobs during that period and 3.3 percent of total Dec. 31, 2018, manufacturing employment of 12.8 million. The continued strength in jobs and number of companies demonstrates a tangible shift in corporate decision-making that is likely to extend the trend of reshoring and localization into the future.
Since 2010, rising Chinese wages, low U.S. energy costs, intellectual property concerns and advancements in technology and automation have been influencing more companies to consider U.S. manufacturing. The recent acceleration is largely based on greater U.S. competitiveness due to corporate tax and regulatory cuts, and increased recognition of the total cost of offshoring. But what effect will tariffs have on 2019?
Companies in a variety of industries had been reshoring long before the current trade conflict since, in some cases, domestic manufacturing/sourcing was the most profitable choice. The continuing trade dispute with China has more companies reevaluating their sourcing and siting decisions. Conversely, a large number of companies cite the unpredictability of the Trump tariffs, including the steel and aluminum tariffs, as a negative: raising costs, increasing uncertainty and delaying investment.
About 25 percent of what is being sourced or produced offshore for U.S. consumption would be more profitably reshored even without the Trump tariffs. In view of the uncertainty of tariffs and other trade actions it makes sense to identify that 25 percent and reshore it now. Then, if the tariffs are still in place, evaluate the products that the tariffs have made unprofitable to source in China.
We expect the uncertainties from the tariffs will cause 2019 reshoring and FDI to be moderately below the 2018 level.
China is the source of 20 percent of our imports and 59 percent of reshoring. Globalization is slowing due to the increased competitiveness gained by digitization and higher offshore labor costs. International trade costs are increasing because of lengthy supply chains, trade barriers and environmental initiatives.
As work flows out of China, companies that relocate to Southeast Asia are likely to find a less robust industrial infrastructure and rapid wage inflation due to small workforces. They will be forced to shift work again in a few years to India and then Africa.
In many cases, it is more profitable and sustainable to shift to the U.S. now.
Factors Cited for Reshoring and FDI
About 60 percent of companies decided to offshore based on comparing wage rates, Ex-Works prices or landed costs. Much of the strength of the reshoring trend has been due to companies becoming familiar with a broader range of factors (costs and risks) they had previously ignored.
The cycle of offshoring, learning and then reshoring is well documented in a recent article on www.sciencedirect.com titled “Why in the World Did They Reshore? Examining Small- to Medium-Sized Manufacturer Decisions,” by John V. Gray, et al. The authors examined the decisions by small- to medium-sized enterprises (SMEs) to reshore or remain offshore.
 The observations from Gray’s detailed academic case study are consistent with the conclusions from the less detailed but larger sample size Reshoring Library and the TCO (Total Cost of Ownership Estimator®) user databases (both on www.reshorenow.org):
• A combination of accumulated offshore experience and offshore costs rising relative to domestic costs has driven companies to re-evaluate their offshoring decisions.
• Approximately 25 percent of the offshore work would have a lower total cost if sourced domestically. Use of TCO can justify reshoring some work, but far from all.
• It is far easier to reshore work that is outsourced offshore than in-house offshore.
In sum, decisions to reshore manufacturing operations, as compared to decisions to offshore, appear to incorporate a wider range of factors, many of which are difficult to quantify. Collectively, these costs are known as the “hidden costs.” When added to Ex-Works price, they equal Total Cost of Ownership (TCO).
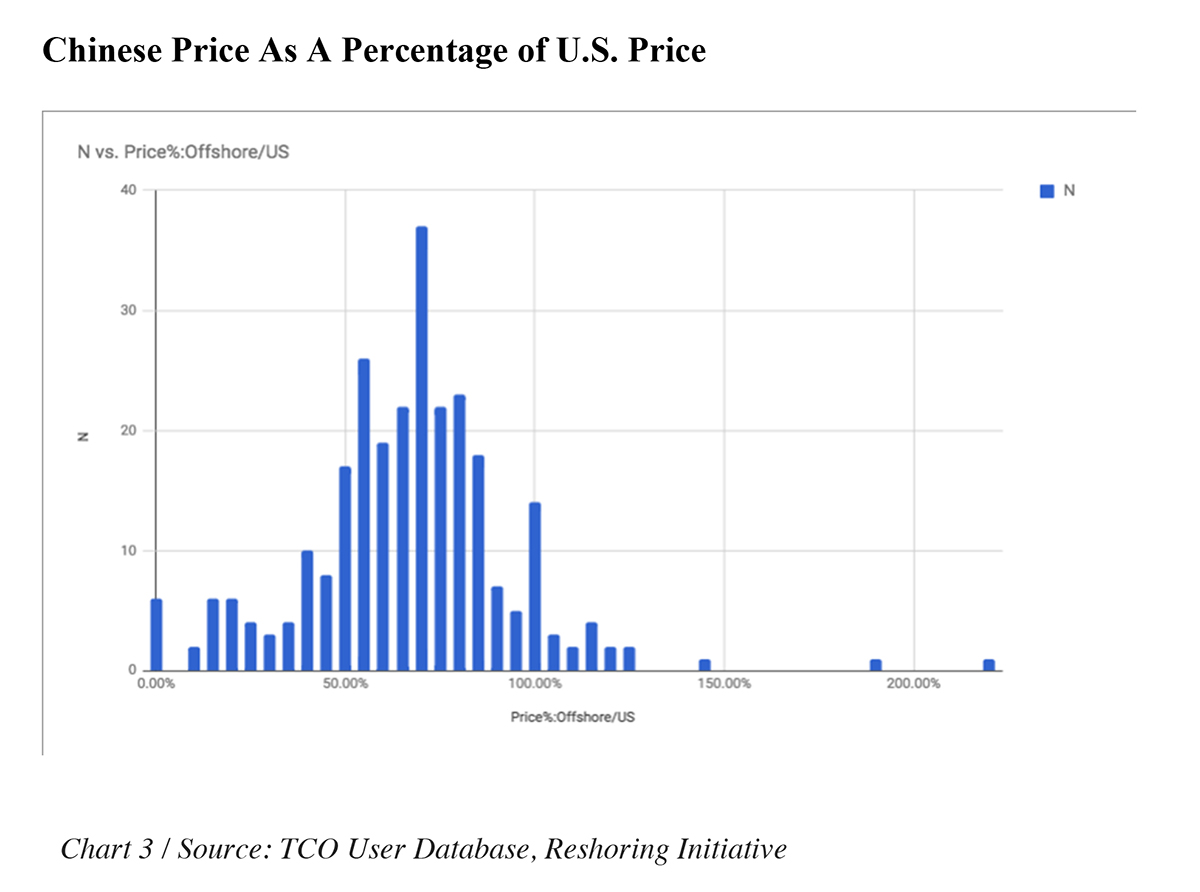
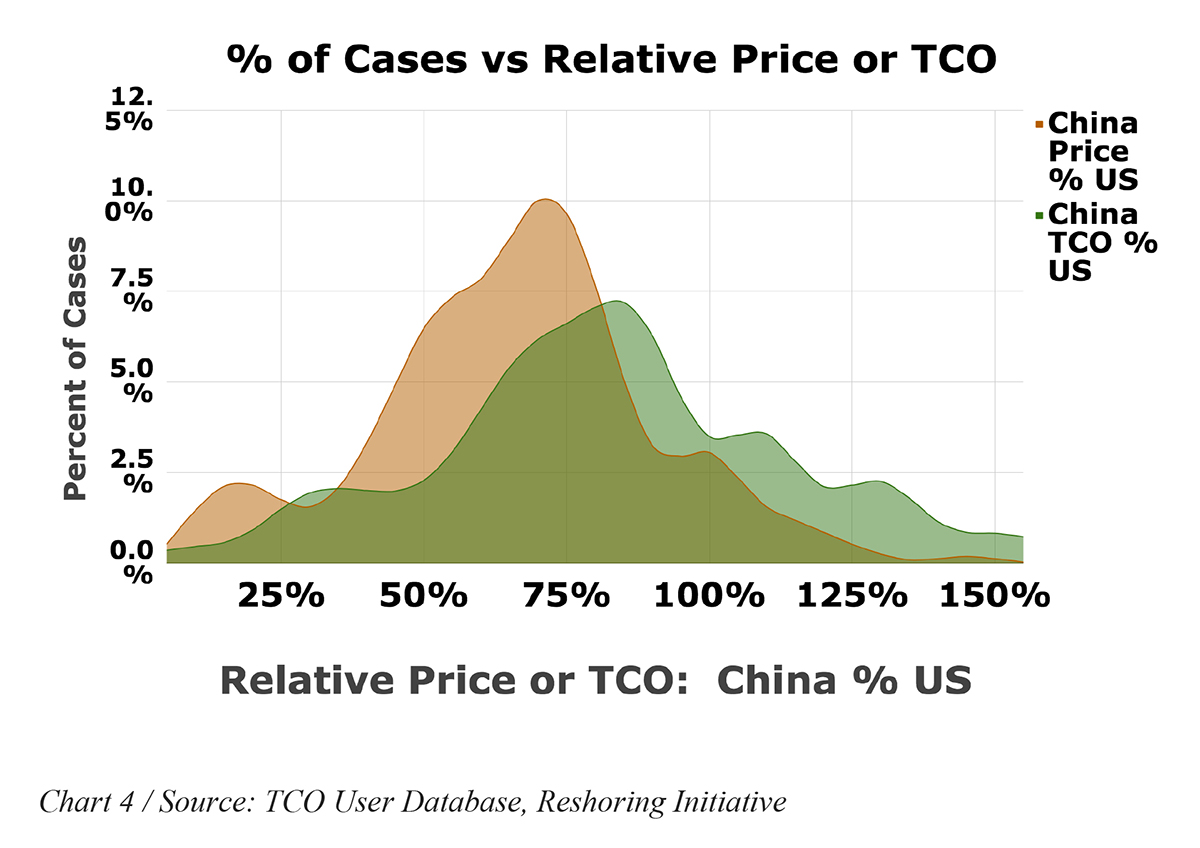 Charts 3 and 4 compare price vs. TCO. Chart 4 shows the distribution of Chinese FOB price as a percentage of U.S. FOB price for a broad range of products. The mode or central tendency for the normal distribution is about 72 percent, demonstrating that U.S. manufacturers are not often going to win based on price alone. However, roughly half of the product imported from China is within 25 to 30 percent of the U.S. Ex-Works price.
In Chart 4, the brown curve is a smoothed version of the same data as the curve shown in Chart 3. The green curve shows Chinese TCO percentage of U.S. TCO, which averages about 85 percent. The U.S. goes from almost never winning on price vs. Chinese sources to winning about 25 percent of the time with TCO.
TCO: A Deeper Dive
Most companies make sourcing decisions based solely on price, often resulting in a 20 percent to 30 percent understatement of offshoring costs. The TCO Estimator, a free online tool, guides companies through a comprehensive system for recognizing and adding all the costs associated with offshoring and reshoring. The relevant cost factors must be fully accounted for to provide a complete picture of total cost.
TCO analysis helps companies objectively quantify, forecast and minimize total cost. It takes into account: freight and duty; travel expense and time; inventory carrying cost; warranty; intellectual property (IP) loss; impact on product innovation from having manufacturing distant from engineering; and the losses from stock-outs due to long delivery times. TCO also quantifies many other factors, such as those associated with the risk of supply chain shocks or disruptions caused by natural disasters and political unrest. It helps to forecast the impact of future wage and currency changes. Using this information, companies can better evaluate sourcing, identify alternatives, and even make a case when selling against offshore competitors.
Others are more subjective, such as IP and natural disaster risk. Once you input your unique data into the Estimator, you will receive your TCO analysis complete with:
• Calculations of 30 cost factors for each source.
• An accumulation of all costs into cost categories.
• The current TCO for each source.
• Line charts showing each source’s current price and TCO, as well as a five-year TCO forecast.
• Line charts for each source showing your cumulative cost, starting with the “hardest” cost—price—and progressively adding in more subjective costs.
The Value of TCO
Placing a real value on shipping, time to market, travel, intellectual property risk, employee time, increased inventory and struggles with communication and quality issues can tip the scales in favor of producing at home. Total cost analysis quantifies more than two-dozen often-ignored relevant costs, most of which individually represent only a small percent of a product’s final total cost. In aggregate, savings from lowering or eliminating these costs can offset some or even all of a 15 to 30 percent advantage in purchase price enjoyed by products made in low labor cost countries.
As companies adopt a more comprehensive total cost analysis, they are finding that the hidden costs of offshoring often counterbalance any remaining savings from cheap labor and price abroad. These companies are investing and sourcing in the U.S. because it makes good economic sense for them to do so.
A broad range of costs and risks can be quantified using the Total Cost of Ownership Estimator. Understanding the reasons other companies have given for reshoring helps companies to determine whether those reasons apply to them also.
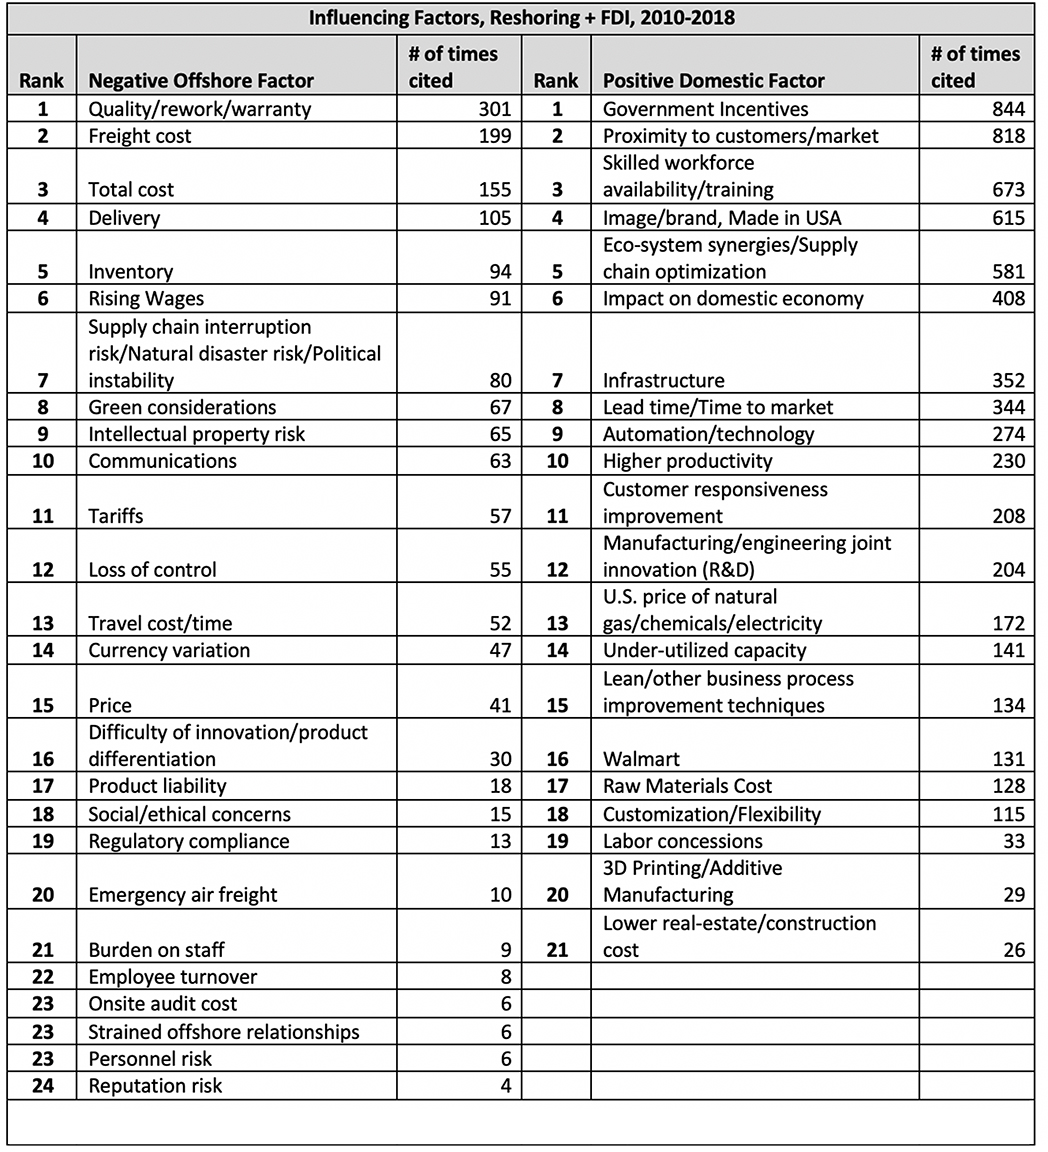
Reporting of factors influencing reshoring and FDI has increased every year since 2010, demonstrating heightened public interest and industry awareness of the previously “hidden costs.” Moving up in the top reasons influencing reshoring and FDI are “Impact on Domestic Economy,” which moved from No. 11 to No. 6, and “Tariffs,” which went from 16 to 11.
“Freight Cost” has always been high on the list for negative offshore factors, however, we expect it and “Green” considerations to become even more relevant as the new emission reduction initiative by the International Maritime Organization (IMO) is implemented in 2019/2020.
In an effort to reduce the shipping industry’s greenhouse gas emissions by 50 percent from 2008 levels by 2050, the IMO will enforce a ban on ships using fuel that has sulfur content of 0.5 percent or higher. Emission reduction costs per ship will run between $1 million to $10 million, with an estimated overall industry cost of $60 billion in additional fuel bills.
Chart 5 highlights the strongest drivers of the reshoring and FDI trends.
Reshoring and FDI by Industry
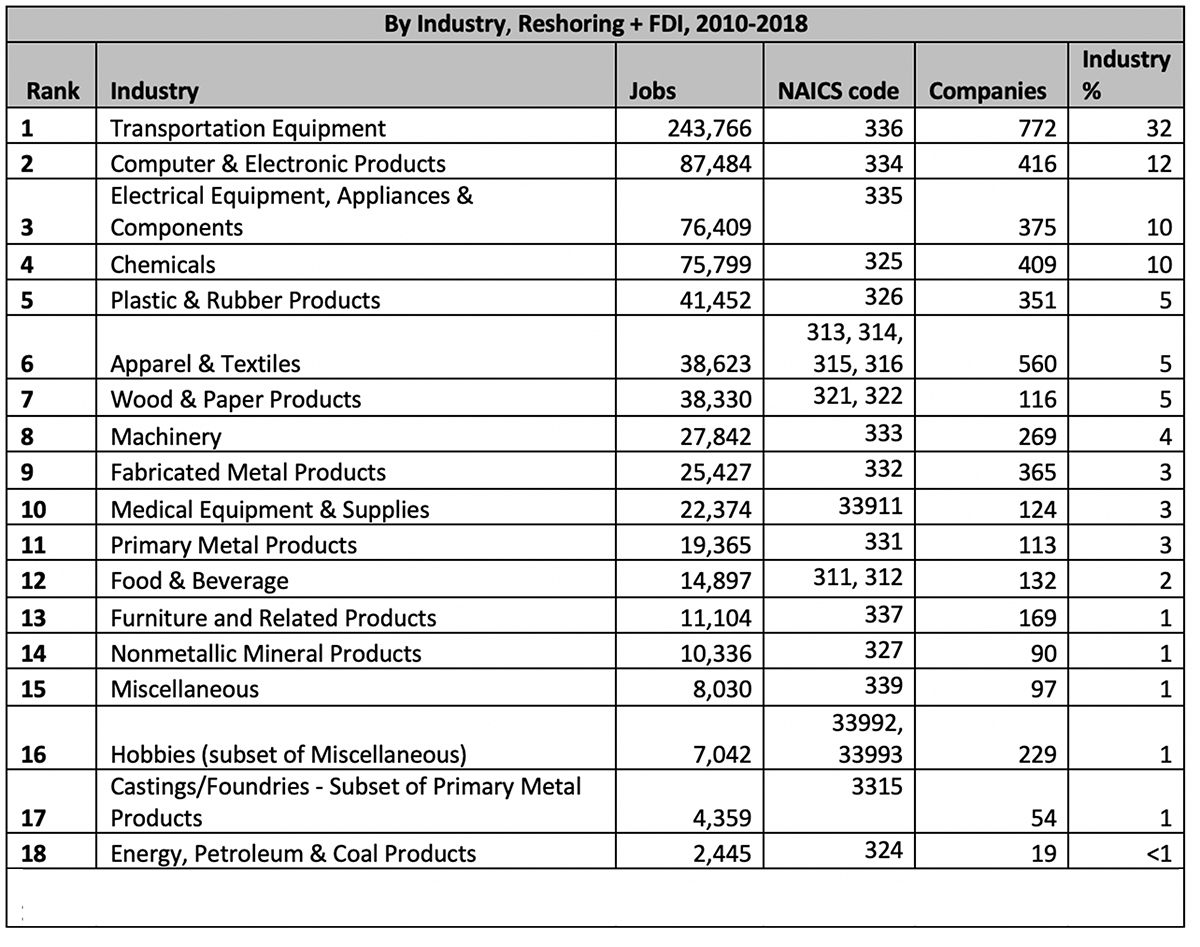
Only products that have been offshored/imported can be reshored. Thus, the products least suitable for offshoring never left, such as heavy, high volume minerals, high mix/low volume items or customized automation systems. The most active reshoring is by those that left and probably should not have done so, including machinery, transportation equipment and appliances.
As the data indicates, reshoring is focused on products whose size and weight—for example, Transportation Equipment—or frequency of design change/volatility of demand—such as some Electronics and Apparel—suggest that offshoring never offered great total cost savings.
FDI is more heavily weighted toward Transportation Equipment because of the ongoing investment in automotive assembly plants and related suppliers. It also benefits the most from government incentives.
In 2018, Chemicals moved from sixth place to fourth place, due to fracking and the resulting low price of natural gas. Primary metal products climbed from 15th to 11th, presumably due to the steel and aluminum tariffs. (Chart 6).
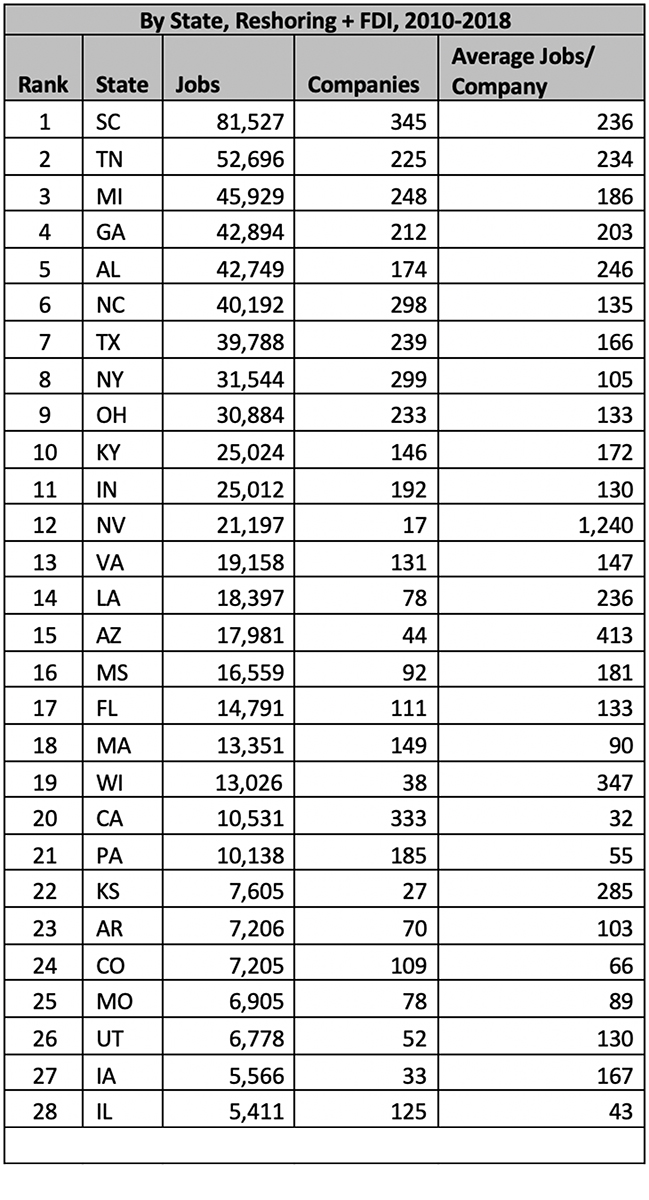
The Southeast and Texas get the most and, on average, the largest projects, presumably due to right-to-work laws and typically lower property costs, wage rates, taxes and energy costs. The Midwest, led by Michigan, is second based on reshoring to its strong industrial base. Duly noted are Nevada, which moved from 28th to 12th (due to the Tesla/Panasonic lithium battery plant), Alabama, which moved from seventh to fifth, and Kentucky, which moved up from 15th to 10th (Chart 7).
Skilled workforce availability is the No. 1 criterion in site selection. Consider regions that are reshoring aggressively and promoting the trend. The image of manufacturing careers will be enhanced, strengthening recruitment into training programs. Check the MSSC (Manufacturing Skills Standards Council) M&L Certification Index for the number of manufacturing and logistics certificates awarded in each state or locality.
Other Tools Available
The non-profit Reshoring Initiative (www.reshorenow.org) has tools and data that can help companies make better sourcing decisions and sell against imports.
• The free online Total Cost of Ownership Estimator can help in sourcing decisions and can be used as a sales tool against imports. One company used the Estimator to convince its customer of the benefits of local sourcing and saved a $60 million order.
• Use the Reshoring Initiative Library’s “Advanced Search” feature to see which companies are reshoring. Find which of your competitors have reshored and their issues and successes. Find sales prospects committed to domestic production.
• Use the Import Substitution Program to identify large importers of what your company produces. Use the TCO Estimator to convince them to reshore and buy from you.
• Compete in the Third National Metalworking Reshoring Award competition for parts made via metal-forming, fabricating, casting or machining.
• Compete in the Sewn Products National Reshoring Award competition in categories including Cut and Sew Manufacturers, Textile Providers (products produced in the U.S.) and Brands.
• The Reshoring Initiative also has a six-times-a-year e-newsletter.
For more information or advice, contact the Reshoring Initiative at info@reshorenow.org or 847-867-1144. T&ID
About the Author