
WERC’s goal is to help operations professionals — including directors, managers and supervisors — better understand how their facility’s performance stacks up to others in the field. The study captures 45 key operational metrics and groups them into five categories: customer, inbound/outbound operations, financial, capacity/quality and employee/safety. It also tracks metrics related to perfect order and cash-to-cash cycles.
The research is conducted by Joseph Tillman, founder of TSquared Logistics, Karl Manrodt, PhD, professor of logistics and director of the Master of Logistics and Supply Chain Management program and Donnie Williams, PhD, assistant professor of logistics and supply chain management, both at Georgia College & State University. In January 2015, 460 WERC members and DC Velocity magazine readers shared their actual 2014 performance levels.
The Big Picture Findings
So what can your operations teams learn from the study?
First, C-level executives and corporate boards of directors have a keen interest in warehousing, distribution and supply chain performance. They also understand the importance of these functions to corporate success. Nearly 32 percent of respondents report to the C-suite, a number that’s grown steadily over the past four years. Also, companies have become more adept at accessing internal metrics and converting them into actionable process improvements — thanks to advanced computing systems that can leverage big data and analytics.
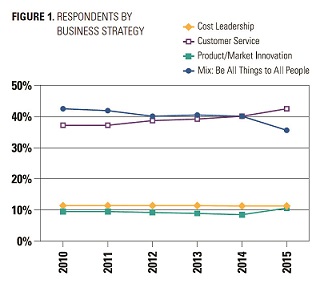
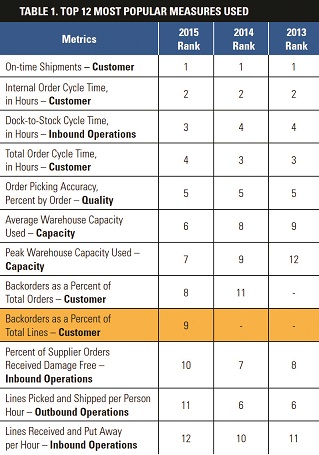
Second, operations have shifted their strategic focus to emphasize customer service over three other business strategies: cost leadership, product/market innovation or being all things to all people (see Figure 1). The emphasis on customer service as a strategy is clearly supported by an analysis of the top 12 most popular measures used by survey respondents (see Table 1). Of those 12, the most frequently employed metrics were:
On-time Shipments
Internal Order Cycle Time (in Hours)
Dock-to-Stock Cycle Time (in Hours)
Total Order Cycle Time (in Hours).
With the top four focusing on customer order fulfillment and velocity measures in 2014, there is a noticeable shift from last year’s findings, which emphasized operational performance metrics.
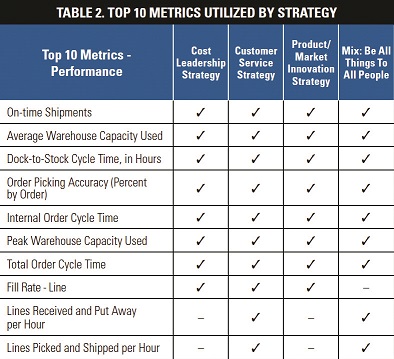
 Finally, respondent data from the past five years was combined to detect any commonalities or differences in the metrics used to measure performance by four operational strategies. Interestingly, seven of the top 10 metrics are used by each strategy — marking very little differentiation between each (see Table 2)! The seven are:
On-time Shipments
Average Warehouse Capacity Used
Dock-to-Stock Cycle Time (in Hours)
Order Picking Accuracy (Percent by Order)
Internal Order Cycle Time
Peak Warehouse Capacity Used
Total Order Cycle Time.
That finding suggests companies are actually not utilizing their warehousing, distribution and supply chain capabilities as a means to truly differentiate their business and its offerings to its target market. It’s a surprising result, and one that the research team intends to explore in its next annual study.
What the "DC Measures" Report Can Do for You
To help companies understand the operational metrics it should focus on to achieve its business strategy goals — relative to "DC Measures" findings — WERC offers customized comparative reports, including medians and quintile rankings specific to industry, customer type and company size.
Additionally, several metrics identified in the study have been embedded into business intelligence tools offered from software provider TECSYS. Users of the Visual Metrics executive dashboard tool can easily see where their operational key performance indicators (KPIs) align to those of competitors as benchmarked by WERC’s industry study.1
 How Intermountain Healthcare Uses WERC’s "DC Measures" Report
Headquartered in Salt Lake City, Utah, Intermountain Healthcare is a not-for-profit organization of 36,000 employees serving patients through 22 hospitals, over 200 clinics, 26 retail pharmacies and home-care services. Intermountain’s Supply Chain Organization was formed to centralize and leverage services for optimal efficiency across the system.
Gordon Slade, Intermountain’s director of supply chain logistics, and his team put together the business case and design for a new approach: unify all supply-chain-related functions into one centralized location that serves Intermountain’s entire network.
“We looked for ways to bring supply chain literally out of each hospital’s basement,” he recalled. “Each hospital had a large storeroom in the basement where supplies were stored for that one facility. Similarly, each had its own area for purchasing, clinical engineering, information technology (IT), printing and more.”
The result was the $40 million Kem C. Gardner Supply Chain Center. Opened in 2012, the 327,000 square-foot facility houses not only a 160,000 square-foot logistics and distribution center (DC), but almost every other function associated with supply chain. These include pharmacy packaging and distribution, sourcing, procurement, purchasing, accounts payable, analytics, printing, IT, and clinical engineering maintenance and medical equipment repair and operations (MRO) parts. The facility has increased service levels of just over 5,000 SKUs and has justified its investment with additional value that couldn’t have been imagined initially.
“As a culture, we’re very value- and metrics-centric. We believe that what you don’t measure, you can’t improve. We know we still have room for improvement and we’re collectively committed to drive additional value,” said Slade, who attended his first WERC annual conference in 2011. It was, he recalled, an epiphany.
“I realized that this was the group we needed to work with in order to build the best possible facility we could to improve our logistics,” he said. “WERC allows us to benchmark how our operations are doing against others outside of the healthcare field. We didn’t want to match other healthcare systems’ distribution methodology; instead, we built our strategic objectives for efficiency and value around best practices in supply chain and distribution in general.”
During the design of the facility and the development of the processes used within it, Slade referred to multiple WERC resources, including the Warehousing & Fulfillment Process Benchmark & Best Practices Guide — which he refers to as his operation’s “Bible.”
At the beginning of this year, Intermountain Healthcare participated in WERC’s Warehouse Assessment and Certification Program to determine additional areas for improvement. The facility attained “Best Practice” status in five of eight process groups and “Good Practice” in the remaining three, making it the first DC in the healthcare field to achieve a WERC Certification.
To Slade, the most important outcome of the audit was the list of areas for improvement. Based on that information, he assigned specific teams to work on bettering each of those processes through 2015.
“Our motivation for excellence is centered on our organization’s mission of helping people live the healthiest lives possible. We do this by reducing the cost of healthcare and supporting best practices that improve outcomes for our patients. We believe the supply chain plays a key role in our collective ability to support our mission. The WERC Certification program serves as an opportunity for us to benchmark ourselves in our journey toward excellence in warehousing and distribution; WERC enables us to get there even faster,” Slade concluded.
____________________________________

Note: 1"DC Measures 2015" is available free of charge to WERC members. Non-members can purchase a copy of the report.
About the Author