What is this GIS acronym? In real estate, and especially commercial real estate, the need to collect, store, manipulate, analyze, manage and display data is as old as dirt, no pun intended. However, with the introduction and advancement of Geographic Information Systems (GIS), this need is now extended to include an infinite range of possibilities for “connecting” information to its geographic position. The unique abilities of GIS make complex data analysis come alive by transforming the traditional column and row spreadsheet into a map-based presentation showcasing complex analytics with its geospatial relationships. Because of this unique ability, GIS has become a widely used and highly demanded tool for nearly any business model worldwide — and has tremendous impact when utilized within retail business models for site selection. If you are building and executing strategic endeavors without GIS, then you are likely collecting more dots than you’re connecting.
 GIS in Retail Site Selection
One of the main benefits of using GIS to assist in the site selection process is the ability to visually analyze sites and markets. GIS displays data and information on a map that helps to visualize and interpret trends and relationships within a specified area. GIS analysis uses simple geoprocessing tools as well as complex models and scripts, all of which help to determine the best-possible locations and/or markets during the site selection process. With geoprocessing, you have the ability to spatially compare a site to factors within a market (distance to competitors, total population within a one-mile radius or one hour drive-time, etc.) and make a decision you can be confident about.
When it comes to selecting a successful retail site, we typically begin by considering the needs, wants, expectations and, perhaps most important, the habits of the consumer. A retailer needs to evaluate, among other things:
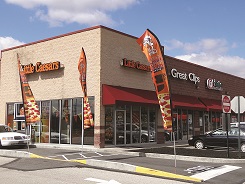
How visible the site is from moving traffic,
What amenities and features are in the immediate area,
What complementary and supplementary retail is in the immediate area,
The demographic profile and facts about the surrounding consumer body including habits and lifestyle practices
How does each of the previous considerations change if you moved just one mile in any direction?
The simultaneous evaluation of just these five bullet points alone would be impossible without the use of GIS. For example, consider the difference in presenting supporting data pursuant to each of the bullets above by:
a map that displays your target area and all of the information needed to help you make your site selection decision, or
a document containing the exact same information, but with numbers and charts spread across multiple pages.
The difference is not just about convenience, but rather it is about effectiveness. Below are three methodical approaches to retail site selection that utilize GIS.
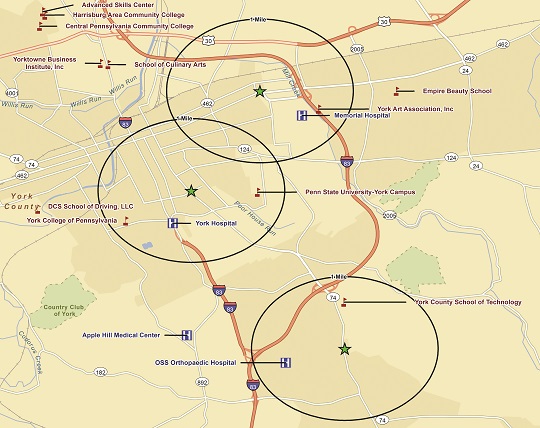
What “market” do I want to be in? A “market” may differ depending on the type and size of the retailer. While a neighborhood beauty salon may consider its market to be only a few block radius of its location, larger retailers such as grocery and department stores may consider their market to be a 20 to 50 mile radius. Whatever the market size, most retailers have a specific set of criteria they need to meet their goals.
Some factors to take into consideration when identifying a market may be:
What type of product or service are you selling?
Who are your current clients and where do they live, work and play?
What target audience would benefit from your product or service and who can afford to purchase your product or service?
Is your business one that your audience will stop at on their way to and from work (convenience) or one that people will make a special trip for (destination)?
Critical factors that may be needed to identify a market can include total population, specific population ranges, household income, daytime population, consumer buying power and the location of schools, hospitals and other major employers, as well as complementary retailers (i.e., a pizza shop may want to be located near a beer distributor).
2. What specific features are needed/desired at a potential location? After a market(s) has been identified, the next step is to determine what features are needed or desired in a location. Some things to consider may be:
Amount of square footage
Type of location (free standing building, corner location, in-line space within a shopping center)
Buy or lease
How much parking is needed
Existing building or “build to suit” (purchasing or leasing a piece of land to construct a building specifically for your needs)
Visibility along roadways, signage and traffic counts
Accessibility from roadways
Other nearby traffic generators (schools, hospitals, universities, entertainment venues or other major retailers such as grocery and department stores).
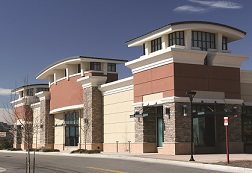 Most shopping centers are located in very visible areas with easy access and complementary stores and services, the perfect setting for a business-to-consumer business model. The emerging trend is that any business that operates under a b-to-c model may benefit from a shopping center location. For instance, medical, dentistry, chiropractic and finance offices may now want to locate in a more traditional retail venue. Look for more of these types of businesses to move into shopping centers in the future.
Similar to the first map, geoprocessing can be performed to narrow down a search for available sites based on the criteria needed or desired in a location. Examples of this type of analysis could include eliminating buildings that are larger or smaller than a user desires, finding buildings or parcels with a specific amount of acreage within zoning districts that allow for the type of use, choosing a location that fronts on roadways that have higher amounts of traffic volume, etc.
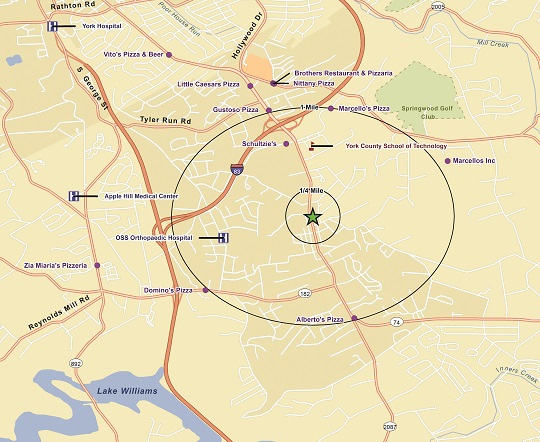
3. Where is my competition located? A valuable source of information to obtain when looking for a new retail location is the location of competitors within chosen markets. Knowing whether or not a market is over-saturated with a specific product could be a determining factor in the success or failure of your chosen location.
Competition mapping offers a quick and easy visual guide of nearby competitors to a selected site. A retailer looking to open a location in a new market should take competitor data into account when analyzing specific locations. If you were looking to open a pizza shop, you probably would not want to do so in a building that has six other competing pizza shops within a two-block radius. You would more than likely want to be located in an area where there are few competing businesses.
When analyzing competition within a market, identifying the following will give you a clear idea of what is happening in your market:
What types of business do you consider your competitors and who are those businesses?
Where are your competitors located at within your market?
What types of products and services do they offer?
What are their hours of operation?
What are the marketing tactics that they use within the market?
A more in-depth approach to competition mapping is what is known as a gap analysis. A gap analysis is a report that is compiled from competitor data and market information on a specific location or target area to determine if there is a surplus or shortage of a product or service.
While competition mapping is quick and easy and gives you a visual understanding of where your competitors are located, a gap analysis can include much more:
Overall market/location information
Resident lifestyle and shopping habits
Business and workforce mix
General demographics such as population and income
Competition data
Market gaps.
Competition mapping and gap analysis can be used to help effectively market properties to potential buyers/lessees. For example, an owner of a shopping center seeking new tenants for vacant spaces can use a gap analysis to determine what types of products or services are needed in their center. A gap analysis can be used to determine what types of tenants to look for and as a way to entice those tenants to lease spaces. This type of strategy could help reduce “haphazard marketing plans” that can be costly and ineffective.
Overall, the keys to any successful business venture are to know your market and use your tools and resources wisely.
While GIS can itself be a tremendous aggregator and presenter of complex data, the next wave of utility for this powerful tool stems from how we incorporate it with other tools such as regression. Simply put, regression analysis is a statistical way of evaluating how well a group of independent variables can explain the behavior of a dependent variable. For example, suppose you believed that when per capita income increases, the independent variable, it results in an increase in housing permits, the dependent variable. There are a number of ways to test this hypothesis including our favorite, regression analysis. Let’s say we gathered data from multiple areas throughout the country that showed the percentage growth in per capita income and then the change in housing permits a year later. The data might look like the table below (note these data have been generated by calculations and are not actual data).
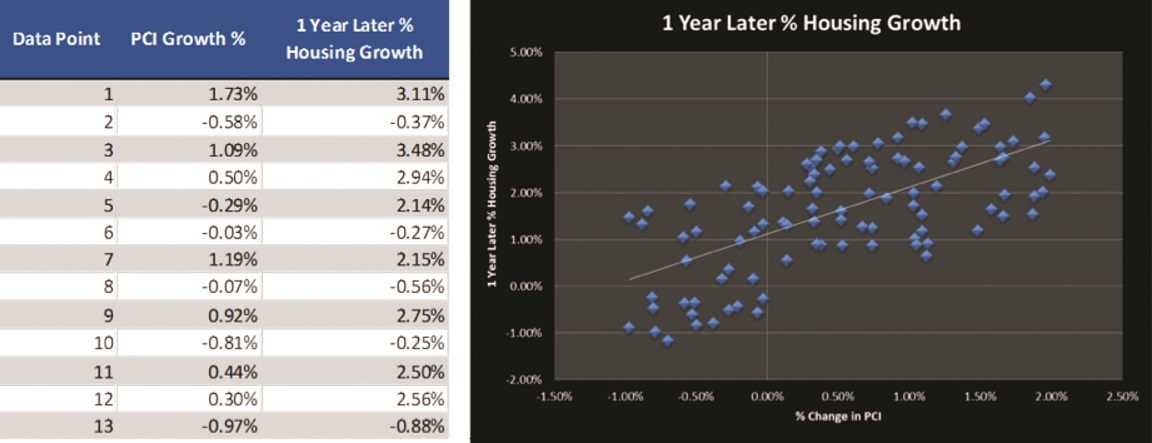
Our hypothesis is: A statistically significant relationship exists between the two variables that may allow us to predict housing growth from per capita income growth. When we run the analysis of this engineered data set, we do find that the relationship is in fact statistically significant and therefore we might conclude that where per capita income is increasing at the greatest rate would be a good market to locate an appliance or home improvement store. To identify such markets, we might sort through pages of Zip Code Per Capita Income Growth, which may take countless hours, or we could use a GIS program to heat map the entire country and quickly zoom in to the most attractive areas while simultaneously identifying which of these markets is missing an appliance or home improvement store.
GIS is simply a powerful tool that is not just empowering better and faster decision making, but enabling a world of greater utility and higher expectations.
About the Author