 A governmental agency needs to consolidate 350 leased office locations in 55 metros down to one location per city. Which ones to keep?
A global industrial manufacturer acquires a leading company in a complementary industry, giving the combined entity a #1 position in North America. Post-acquisition, how do they maximize profitability?
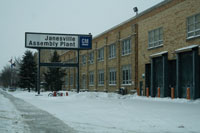
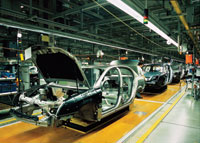
A Tier 1 automotive supplier with multiple manufacturing and assembly facilities faces increasing competition, material and labor costs, and needs to dramatically reduce manufacturing costs. Prior plant consolidations haven’t achieved targets. What’s next?
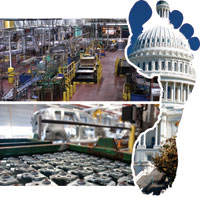
From bankers to bureaucrats, energy execs to manufacturers, the term “Footprint Optimization” is being uttered with increasing frequency in C-suites around the globe as organizations look to reduce facility costs, mitigate competitive pressures, achieve efficiency targets and leverage talent and labor concentrations.
In its simplest terms, optimizing a corporate footprint refers to examining the quantity and geographic dispersion of an organization’s facilities, then adjusting their number and location to reduce duplication, inefficiency or overlap. By locating facilities more strategically to leverage labor or materials availability, enhance supply chain efficiencies, or streamline operations, organizations can achieve significant savings and competitive advantage.
Is Footprint Optimization Right For You?
For manufacturers seeking a step-change in cost reduction across numerous facility locations, Footprint Optimization helps answer the fundamental question of “What should be made, and where?” that holds the key to maximizing organizational value and profitability.
 And while the current economic downturn has many organizations pursuing ways to reduce costs or drive top-line growth – both worthy endeavors – many could receive greater benefit by optimizing their enterprise’s operational footprint. By examining how all the pieces of an organization best fit together, companies can adopt a strategic and holistic approach to how, why and where assets are deployed – and improve operating flexibility and profitability.
Such a process-oriented approach also positions an organization for growth by bringing a range of business issues to the forefront, examining operational requirements, identifying new efficiencies and enhancing access to emerging markets. Unlike a solitary focus on cost reduction, Footprint Optimization allows an organization to capture a wide range of value improvement opportunities. And the process is beneficial to any industry and at any point of economic or business cycles.
Companies should consider Footprint Optimization if:
Decisions affecting the entire organization are being made by individual business units in isolation.
It lacks operating flexibility and needs to position itself for post-recession growth.
It needs to examine challenges holistically, considering efficiencies, talent availability, tax impacts and market access – not just short term savings.
Individual business units have already examined how to optimize their own operations – yet no one has examined all of the pieces together.
Consider that Footprint Optimization can deliver tremendous value in good times and bad. It helps organizations to reduce cost, improve operating efficiency, tap talent across the organizational spectrum, create a more nimble position in key geographies, and increase strategic flexibility – making it easier to respond to changing market conditions.
When to Consider Footprint Optimization
Footprint Optimization is beneficial in four distinct scenarios:
When organizations have to expand capacity
Following mergers or acquisitions
In times of changing product mix
During deep market slumps
 In recent years, a major global energy company with scores of refineries around the world needed to identify which operations were most profitable, where it needed to increase or decrease capacity based upon usage trends, and which facilities would be easiest or most difficult to expand. By using Footprint Optimization, it examined all facilities in question and ultimately made adjustments that resulted in expansion of multiple facilities, the addition of numerous new locations – and resulted in billions of dollars in savings to the company.
This example follows the capacity expansion scenario, and was driven by the need to decide where to expand to improve unit performance to maximize profitability.
The merger/acquisition scenario was evidenced in 2008 when Wells Fargo merged with Wachovia, creating North America’s most extensive distribution system for financial services. By utilizing Footprint Optimization, the company determined precisely which locations to retain, which to close, where operations could be consolidated for efficiency, and where new investment would maximize profitability and market share. Despite the global economic recession that followed shortly after, the combined company has grown to over $1.4 trillion in assets, $800 billion in deposits, 48 million customers – and become arguably the nation’s premier coast-to-coast banking presence.
Changing product and brand mixes are a fact of life as new technologies take root, consumer tastes change, and distribution channels drive product and packaging modifications. If Procter & Gamble, for example, detects a growing opportunity to sell more Tide and Bounce detergents while needing to ratchet down production of Comet, Zest or Pepto Bismol, or needs to convert Cascade production from powder to tablets, it forces the organization to make intelligent decisions on where to increase and decrease capacity, and where to add or convert production facilities to meet changing marketplace demands.
 Finally, market slumps drive many a decision. The auto industry has been extremely hard hit by the economic downturn, forcing automakers and suppliers of engines, transmissions and components to examine where to reduce capacity, which facilities to close and which to maintain – or expand – production at to position themselves for success post-recession.
With options for consolidation, closure, expansion, off-shoring and outsourcing becoming increasingly complex, organizations need insight, speed and adaptability – and a proven process -- to deal with changing business conditions and reveal considerations and costs inherent in footprint and asset optimization.
The Footprint Optimization Approach
The Footprint Optimization process entails a comprehensive comparative analysis of an organization’s physical assets, locations of operations and relationship to markets to help understand the competitive environment, and how and why each facility contributes to a corporation’s strategic objectives.
The study further assists management in fundamentally understanding future growth of the organization in multiple ways:
By facility
By industry, product line or region (through relationships of facilities/assets to markets)
Company-wide (relationships of multiple groups to multiple markets)
The study identifies facilities that are redundant or do not meet corporate objectives, while highlighting those with outstanding performance and increased potential. The initiative also deploys a straightforward quantitative approach that minimizes bias, improves objectivity in decision-making and builds consensus throughout an organization.
While models vary by consultancy, most combine a quantitative Risk Analysis with a Decision Analysis, such as Global Location Strategies’ (GLS) preferred two dimensional Kepner-Tregoe® approach.
This combination allows organizations to understand asset utilization and factors influencing asset optimization on both a macro and micro level, analyzing factors on both a Return on Investment (ROI) and Return on Asset (ROA) basis, while examining drivers specific to your company and industry – from market access and safety to supply chain integration or reliability of suppliers.
A Six-Step Process
 The Footprint Optimization methodology is a transparent and logical process of evaluation. It is highly adaptable and customizable to help management comprehensively understand corporate assets, their interrelationships and contributions as assessed by a proven and unbiased expert. Typically, organizations with expertise in facility location, incentives negotiation and real estate -- and a track record with Footprint Optimization studies -- are a good partner. A firm like GLS utilizes industry engineering experts to provide the latest technological innovations in the industry, and typically categorizes methodology into six distinct steps.
Step 1 – the Pre-Project Analysis -- occurs before an “official” alignment, or kick-off, meeting, and entails your consultant and team gathering information essential to company and industry. This includes detailed data on current and future market requirements, as well as the current logistics network in place for each facility. Through this, your consultant begins to develop and identify top factors influencing your business.
Step 2 – Logistics & Market Assessment – entails developing a full understanding of the current market for every facility, ranging from raw material supply considerations to finished goods distribution, so that a comprehensive supply chain analysis can be performed. Analysis provides a clear picture of how all facility-assets are utilized to obtain raw materials, provide goods to the marketplace, and how they interrelate. Potential markets are assessed and evaluated to determine impact of increasing or emerging areas of opportunity.
Step 3 – Strategic Alignment and Definition of Business Goals/Objectives -- A formal kick-off with a critical project alignment meeting incorporates all key players within the organization -- essential to gaining consensus on the initiative's strategic objectives. Your consultant will lead this forum for identifying and discussing forces and factors influencing your business, cultivating project ownership and commitment with each participant. Insights from the Pre-Project and Assessment phases is reviewed, and active participation by management and core team members is essential.
Step 4 – Understanding Current Conditions – Following the alignment meeting, your consulting partner completes a thorough due diligence assessment of all project sites, gathering detailed information from a range of information sources – corporate representatives, site managers, regional economic development representatives, industry experts, and the like. Once obtained, this data is used to populate decision and risk models for analysis.
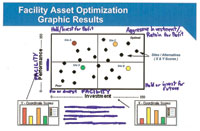
Step 5 – Prioritizing Business Needs – The Decision Analysis -- While various consultancies deploy different approaches to decision analysis, most use a decision analysis model refined over time to identify and rank critical business-influencing factors. Since every organization is unique in the forces impacting its operations and success, identifying and ranking these drivers is extremely important.
Using Global Location Strategies' proprietary approach as an example, which incorporates Kepner-Tregoe methodology, Facility Performance and Facility Investment status factors are identified and weighted, creating an analysis on a two-dimensional level.
The following table provides examples of project factors, and their “weights,” for a hypothetical project:
Kepner Tregoe Factors & Weighting -- Example
| Facility Performance | WT. | Facility Investment | WT. |
| Raw Materials | 10 | Strategic Marketing Fit | 10 |
| Reliability of Supply | 9 | Return on Investment | 9 |
| Efficiency | 8 | Capital Upgrade Needs | 8 |
| Supply Chain Integration | 7 | Raw Materials | 7 |
| Cost/unit Produced | 6 | Operating Costs | 6 |
| Safety | 5 | Local Incentives | 5 |
| Product Delivery | 4 | Opportunity Costs | 4 |
| Expansion Capability | 3 | JV Opportunities | 3 |
| ROI on Tech Upgrade | 2 | Performance Indicators | 2 |
| Labor-Mgmt. Relations | 1 | Long-term Growth Market | 1 |
This approach is invaluable due to its comprehensive methodology, limiting conscious and unconscious bias that may sidetrack a decision away from its objectives. This methodology is applicable to decisions other than Footprint Optimization, including product marketing and site selection.
Both a SWOT and Risk Analysis is completed on each facility, identifying risks to Facility Performance and Facility Investment that may have bearing should events outside the company’s control occur (for example, if land intended for expansion and not under your control is acquired by another firm, blocking your expansion capability).
Step 6 – Final Recommendations & Deliverables -- Results and outcomes of the Footprint Optimization analysis provide insight that is not only beneficial today, but which provides a clear picture of asset utilization and related factors on an ongoing basis – fundamental to making sound, forward-looking decisions.
Your primary study outcomes include specific recommendations on how best to optimize your footprint/assets to reduce facility costs, mitigate competitive pressures, achieve efficiency targets and leverage talent and labor concentrations, and include:
Facility Investment Status Scenario Comparative Analyses
Facility Performance Status Scenario Comparative Analyses
Combined Investment and Performance Matrix Analysis
Strength & Weakness Assessments
Future Developments & Risk Assessments
There are a number of side benefits you receive as well:
a proprietary database of “knowledge” on each facility
a “footprint” of the study to enable repetition of the comprehensive analysis
weighted project criteria, scoring scales and basis for rankings
analytical models
a comprehensive understanding of key differences of your facilities and locations
A Final Word
When all is said and done, and every bit of available information has been analyzed in pursuit of making the right decisions, it is ultimately the company who must implement and live with Footprint Optimization decisions. When good decisions are made, everyone wins – company, communities and consumers.
Ultimately, a thorough and effective analysis makes all the difference. Be diligent, be methodical, be detailed and be thorough. Doing so will help you make intelligent, defensible and well-considered decisions.
About the Author